

Bures-Wasserstein distance between geometries#
Author: laquitainesteeve@gmail.com
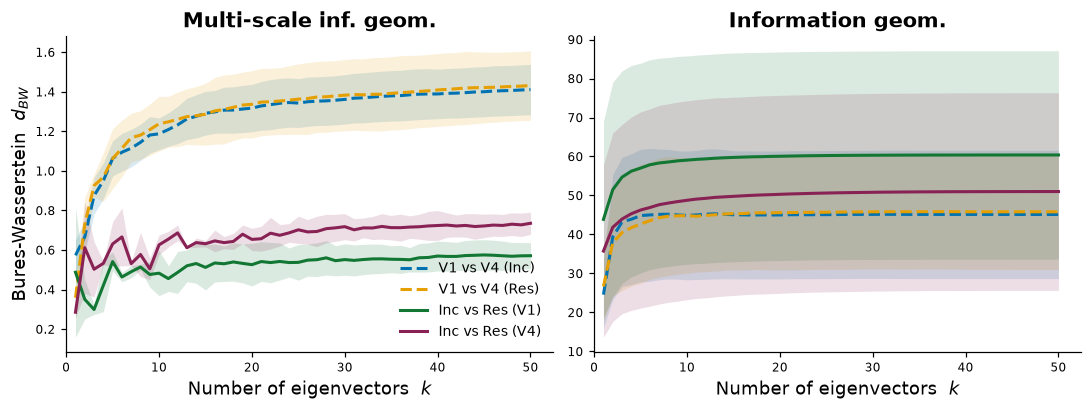
Goal: Plot the Bures-Wasserstein distance between the geometries of two models or two areas, as a function of the number k of leading eigenvectors kept (paper Fig. 6). It checks that the conclusions of Fig. 4D-E do not depend on the similarity measure.
Requirements: the outputs of notebook 4 (
runs/per_image/). A CPU is enough.Time: minutes.
Details
Distance: the alignment of Fig. 4D-E compares only the orientation of the leading eigenvectors;
d_BWalso penalises differences in scale. For two metricsAandBwith rank-kreconstructionsV_A diag(l_A) V_A^TandV_B diag(l_B) V_B^T,d_BW(A, B)^2 = tr(A) + tr(B) - 2 tr((A^(1/2) B A^(1/2))^(1/2)). It is computed without forming the 4096 x 4096 matrices, fork = 1..50and every pair of (encoder, area) configurations, and averaged over the test images that the two configurations share.Four comparisons: V1 against V4 within Inception and within ResNet-50 (same model, different areas, dashed), and Inception against ResNet-50 within V1 and within V4 (same area, different models, solid). Left: G(x). Right: J(x).
What the paper reports: for G(x) the cross-model distances (solid) lie below the cross-area distances (dashed); for J(x) the order reverses, as in Fig. 4D-E.
The supporting functions are in
multigeom.analysisandmultigeom.pipeline.alignment; the plot isfigures/alignment.py. This notebook only sets parameters and calls them.
1. Setup#
1.1. Install package#
On Google Colab, install multigeom; elsewhere this does nothing.
[ ]:
%%time

# on Google Colab install the package from PyPI, without its dependencies: Colab already
# has torch, numpy, scipy and matplotlib, and reinstalling torch is slow and can break
# the GPU runtime (nothing to do on your own machine)
import sys

if "google.colab" in sys.modules:
    %pip install -q --no-deps --pre multigeom
1.2. Inputs#
The distances use the per-image eigenvectors and eigenvalues in runs/per_image/, estimated by notebook 4 (4_subspace_alignment.ipynb). At least two configurations are needed; all four comparisons need Inception and ResNet-50 for both V1 and V4.
Details
The paper averages over 200 test images and all configurations; with fewer images the curves are noisier.
[ ]:
%%time

# import built-in packages
import os, sys
from pathlib import Path
import importlib

# move to the repository root (the folder containing environment.yml): data/ and runs/
# are read from there
root = Path.cwd().resolve()
while not (root / "environment.yml").exists() and root != root.parent:
    root = root.parent

if (root / "environment.yml").exists():
    os.chdir(root)

sys.path.insert(0, str(root))  # the figures/ folder of this repository

# import custom packages
from multigeom.utils import show_figure
from figures.alignment import plot_bures_wasserstein
from multigeom.pipeline import alignment as bw

importlib.reload(bw)  # update the module without restarting the kernel

# parameters
# folder with per_image/<encoder>/<area>/img*.pt (written by notebook 4)
RUNS_DIR = "runs"

# which per-image files exist for each configuration
summary = bw.print_inputs(RUNS_DIR)
2. The distances#
Runs multigeom.pipeline.alignment (minutes at most, on the CPU) and writes runs/metrics/cross_encoder_metrics.json, which also holds the subspace alignment of Fig. 4D-E. It does nothing if fewer than two configurations have per-image files.
time: 1 sec
[2]:
%%time

# distances between every pair of configurations, saved as JSON
metrics_path = bw.compute_metrics(RUNS_DIR, out_dir=f"{RUNS_DIR}/metrics")
[Stage 5] Found 4 (encoder, area) configs:
     inception / V1: 6 images
     inception / V4: 3 images
      resnet50 / V1: 2 images
      resnet50 / V4: 2 images
[Stage 5] Saved 12 pairwise comparisons to runs/metrics/cross_encoder_metrics.json

[Stage 5] Paper comparisons (mean over images):
  cross_area_inception__G                       A_20 = 0.505 ± 0.032   d_BW(k=20) = 1.32   n = 3
  cross_area_inception__J                       A_20 = 0.425 ± 0.047   d_BW(k=20) = 45   n = 3
  cross_area_resnet50__G                        A_20 = 0.476 ± 0.046   d_BW(k=20) = 1.34   n = 2
  cross_area_resnet50__J                        A_20 = 0.283 ± 0.056   d_BW(k=20) = 45.6   n = 2
  cross_model_V1_inception_resnet50__G          A_20 = 0.834 ± 0.030   d_BW(k=20) = 0.526   n = 2
  cross_model_V1_inception_resnet50__J          A_20 = 0.146 ± 0.022   d_BW(k=20) = 60.1   n = 2
  cross_model_V4_inception_resnet50__G          A_20 = 0.833 ± 0.010   d_BW(k=20) = 0.654   n = 2
  cross_model_V4_inception_resnet50__J          A_20 = 0.103 ± 0.015   d_BW(k=20) = 50.3   n = 2
CPU times: user 2.36 ms, sys: 86 μs, total: 2.44 ms
Wall time: 1.12 s
3. Does the order match the paper?#
The mean of d_BW over k for the two cross-model comparisons and the two cross-area comparisons, for each metric. The paper reports cross-model below cross-area for G(x) and the reverse for J(x).
[3]:
%%time

# mean distance over k: cross-model against cross-area, for each metric
if metrics_path is None:
    print(
        "Nothing to check yet: the alignment needs at least two configurations "
        "(see "
        "the message above)."
    )
else:
    metrics = bw.load_metrics(metrics_path)
    order = bw.print_ordering(metrics)
G: mean d_BW over k: cross-model 0.597, cross-area 1.29  -> paper expects cross-model below cross-area: yes
J: mean d_BW over k: cross-model 54.4, cross-area 44.6  -> paper expects cross-model above cross-area: yes
4. Plot Fig. 6#
Solid: different models, same area. Dashed: the same model, V1 versus V4. Bands: s.e.m. across the images. The paper also compares ON-OFF, for which there are no checkpoints here.
time: <1 sec
[4]:
%%time

# Bures-Wasserstein distance against k, for the four comparisons
if metrics_path is None:
    print("Nothing to plot yet: run the cells above first.")
else:
    show_figure(plot_bures_wasserstein(metrics))
CPU times: user 331 ms, sys: 19 ms, total: 350 ms
Wall time: 350 ms